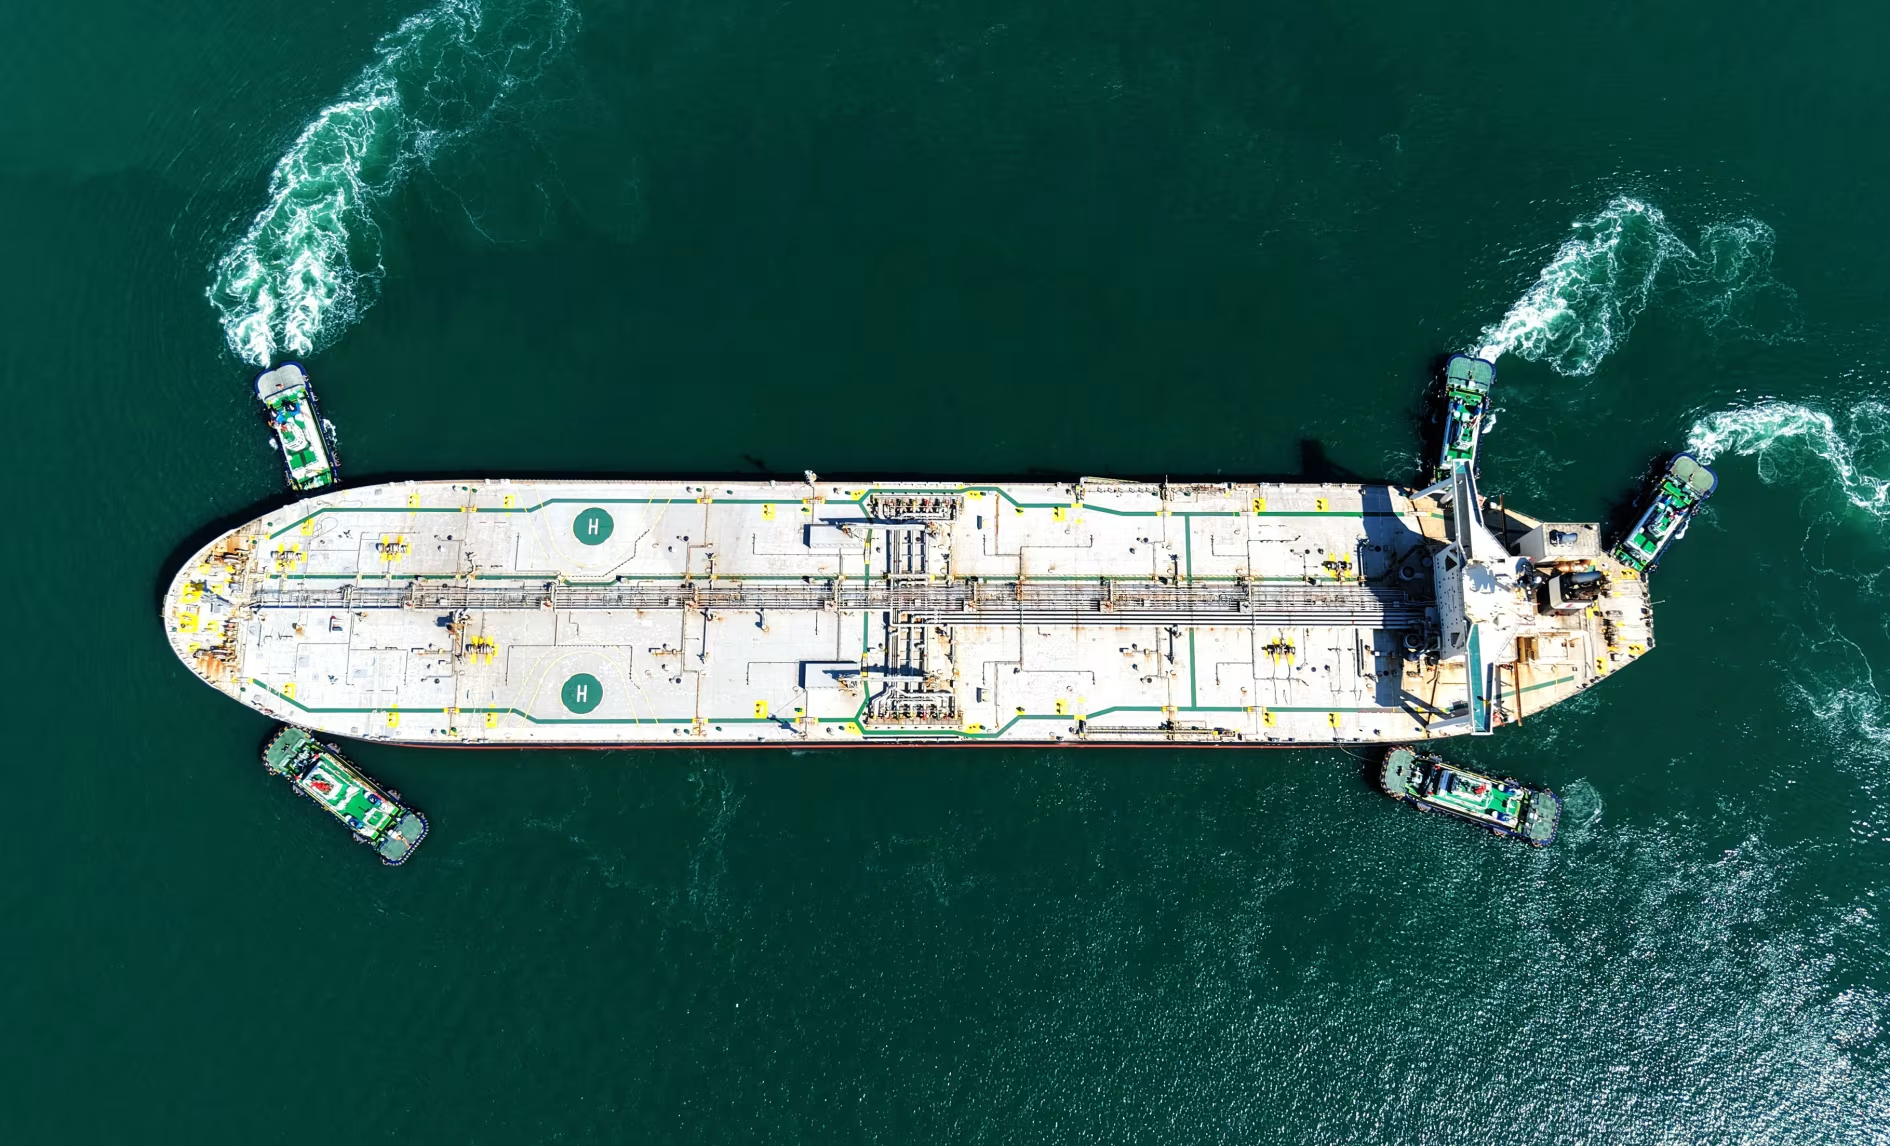
The second-largest producer of liquid natural gas in the world is Cheniere Energy, based in Houston.
The energy sector appeals to contrarian investors who think the overall stock market is overpriced. However, you will have to be patient. Additionally, seasoned energy market analysts have four particular stock recommendations for you if you think that the demand for electricity to power artificial intelligence and data centers will skyrocket.
To set the scene, let’s examine the future price-to-earnings estimates for the S&P 500 SPX’s 11 sectors. These prices are weighted by market capitalization and split by consensus earnings-per-share projections for rolling 12-month periods. With the entire index at the bottom, the sectors are arranged from lowest current valuation to highest.
 Sector or index           Forward P/E  2025 return  3-year return
   Energy                           15.4         7.5%          19.6%
   Financials                       16.7        12.6%          70.6%
   Healthcare                       16.8         0.8%          14.5%
   Real Estate                      18.0         5.7%          10.6%
   Utilities                        18.2        13.0%          22.2%
   Communication Services           20.3        17.9%         121.5%
   Materials                        20.6        11.6%          27.3%
   Consumer Staples                 22.5         5.5%          24.4%
   Industrials                      24.4        16.1%          68.1%
   Information Technology           29.2        14.0%         122.1%
   Consumer Discretionary           29.3         2.0%          52.9%
   S&P 500                          22.3        10.8%          67.7%
In this article, reinvested dividends are included in all total returns.
On a forward P/E metric, the S&P 500’s energy sector continues to be the most affordable. This year, it has trailed the entire index, and its 19.6% three-year return is less than one-third of the S&P 500’s return.
“We are not investing enough in oil.” ClearBridge Investments’ Sam Peters
By holding all 22 equities, weighted by market capitalization, the Energy Select SPDER ETF XLE is intended to replicate the performance of the S&P 500 energy sector. However, you may like to broaden your horizons and adopt a more selective approach to the market, going beyond this limited selection of stocks.
The Gabelli Utility Trust GUT and Gabelli Asset Fund GABIX are co-managed by Simon Wong, an energy-sector analyst at Gabelli in New York, who told MarketWatch that crude oil would likely be rangebound between “the high $50s and the low $70s,” partly because “the Trump administration doesn’t like high oil prices.”
“Every time there are high oil prices,” President Trump “seems to find a way to knock [them] down through social-media postings, press conferences or what have you,” Wong continued.
Although they reached an intraday high of $79.39 on January 15, just before Trump started his second term as president on January 20, the New York Mercantile Exchange’s continuous front-month contract prices for West Texas Intermediate crude oil (CL.1) fell to $65.77 early Tuesday from $71.72 at the end of last year. June saw a price increase as well. This is a WTI chart for the current year:
The market’s expectations for rising supply at a time when China’s demand for crude oil is “not growing, or even declining,” Wong added, may have been more significant than Trump’s reflections. Additionally, India’s demand remains constant from year to year. We anticipated that demand would increase by 3% to 5%.
As the cartel relaxes production limitations, Wong also anticipates that OPEC nations “will add back about 2.2 million barrels a day by the end of this year” to the global supply of crude oil.
Exxon Mobil Corp. (XOM), Chevron Corp. (CVX), and CNOOC Ltd. (HK:883) are leading emerging offshore projects in Guyana, which are anticipated “to add about 1.5 [million] to 1.6 million barrels a day in incremental supply,” according to Wong.
Considering all of these variables, Sam Peters, a portfolio manager at ClearBridge Investments in New York, who was also interviewed for this story, stated that the stock market was “already discounting $50- to $55-a-barrel oil.”
Since 2010, Peters has served as a co-manager of the ClearBridge Value Fund (LMNVX).
The trend of liquefied natural gas
Natural gas (NG00) has also decreased this year, from $3.098 at the end of last year to a front-month price of $2.888 MMBtu early Tuesday. However, the price of commodities is not the only consideration when investing in natural gas. It also has to do with the quick growth of American export capabilities.
“I like natural gas,” explained Wong. Due to supply coming online, it has just pulled back. However, he noted that data centers are increasing their demand for natural gas in the next three to five years.
As data centers are built to support the advancement of artificial intelligence technologies, there have been countless predictions of strain on electricity grids. Since it still controls the majority of the market for high-end graphics processing units, or GPUs, Nvidia Corp. (NVDA) has clearly benefited.
All of the generative AI data collection, according to Peters, is “incredibly energy-intensive.”
“We are taking electrons and turning them into inference,” he stated.
“The general consensus is bullish for natural gas and bearish for oil,” Peters stated. “Much of the energy supply for AI will come from natural gas.”
According to Peters, the fervor for natural gas is especially significant for American exporters. The “big leaps” he projected would occur in 2026 and 2027, when “we are going to add about 3 billion cubic feet of U.S. LNG export capacity.”
The Gabelli Asset Fund’s largest energy-sector stake, National Fuel Gas Co. (NFG), was cited by Wong as being “well-positioned to take advantage of rising demand for natural gas and higher prices.”
The majority of NFG’s gas production occurs in Pennsylvania and western New York, which is advantageous because “Philadelphia is the data-center hotbed,” according to Wong.
Cheniere Energy Inc. (LNG), the biggest producer of liquid natural gas in the United States and the second-largest producer globally, after Qatar, is the company that Wong supports. The Houston-based corporation runs gas pipelines and sizable maritime export terminals in Corpus Christi, Texas, and Cameron Parish, Louisiana.
As a long-term investment, Wong also favors Kinder Morgan Inc. (KMI), a pipeline and terminal operator.
According to Peters, EQT Corp. (EQT) is the only vertically integrated natural gas producer in the United States. LNG and KMI are all things he is excited about, although he said that EQT is “a bit spicier” because it is “more leveraged.”
Returning to oil
“The opposite of gas is oil. Everyone has a poor opinion of oil. “Oil bearishness is based on oversupply into next year, whereas gas has demand pull,” Peters stated.
“OPEC is to blame. He claimed that when output quotas were established to support prices, Saudi Arabia grew weary of its OPEC colleagues’ deceit.
President Donald Trump “seems to find a way to knock [them] down through social-media postings, press conferences, or what have you” whenever there are high oil prices. Gabelli and Simon Wong
Investors may perceive another leg down for oil producer shares as an alluring entry point, given that the market has already established the groundwork for $50 oil prices.
Putting aside specific investment timing, Peters thinks this graph supports oil’s long-term case:
The chart on the left illustrates how capital expenditures rose during periods of low U.S. supply. This was reversed beginning in the middle of 2014, when the massive increase in U.S. shale output caused crude oil prices to drop for a long time until the beginning of 2016. Beginning in 2022, you can observe an increase in expenses on the chart’s right side.
According to Peters, “the wildcard for next year is shale backing off” because there is so much additional production coming online. After being burnt during the 2014–16 oil price slump, which saw a wave of bankruptcies and consolidation among smaller industry players, U.S. producers have been cautious about capital expenditures ever since.
“U.S. Shale production has neem plateauing at current prices,” Wong stated.
Additionally, as of August 22, Baker Hughes’ U.S. oil rig count was 9% fewer than it was a year ago. According to Peters, there were 11% fewer rigs in May than there were a year prior.
Peters described the drop as “a nice offset” to growing supply from outside the United States, saying, “I personally believe the shale cutback is underestimated and that U.S. barrels will increasingly be flat to declining as we get into 2026.”
Despite the late-stage shale production and his belief that “we are underinvesting in oil,” Peters is still a long-term bull. His two preferred methods to play it are as follows:
Schlumberger Ltd. (SLB) was characterized by Peters as “quality when nobody wants it.” The stock has a projected free-cash-flow yield of 11.28% and trades at a forward P/E of 12.3. Based on Friday’s closing price of $36.84 and the 12-month consensus expectation of $2.92 in free cash flow per share, FactSet polled analysts. According to the consensus estimate, there is sufficient spare cash flow to cover a dividend increase because the company has a dividend yield of 3.09%. According to FactSet, Schlumberger’s free cash flow over the last 12 months has increased even further, reaching $3.52.
Free cash flow is “a robust lens” for investors, according to Peters. Even if prices are now declining, he referred to SLB as “a great investment for the next decade.” “And if I am wrong, I get the free cash flow now,” he continued. It’s investing 101, and I’m doing alright.”
Since Chevron’s July acquisition of Hess, which made the corporation a significant role in Guyana’s offshore production, he also loves the company.